Gallery
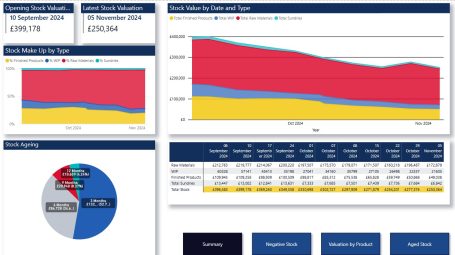
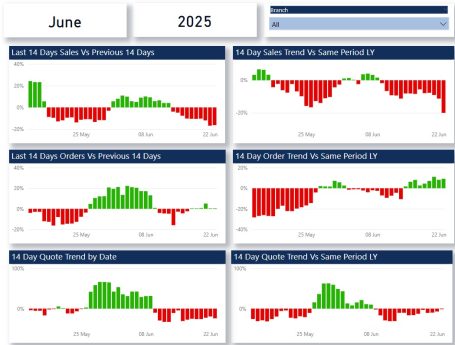
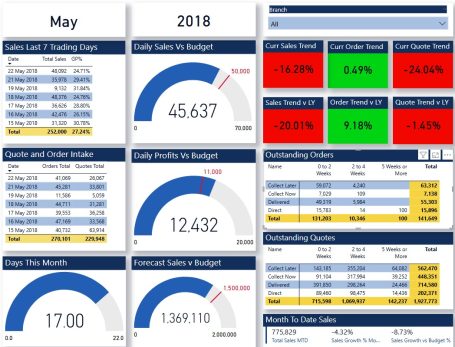
This gallery showcases Power BI dashboards and visualisations designed for financial analysis and business intelligence. The images demonstrate various chart types, interactive reports, and data presentations that transform complex datasets into clear, actionable insights. These examples highlight how effective data visualisation supports strategic decision-making and enables finance professionals to communicate key performance indicators and trends to stakeholders efficiently.


